Resources > Featured Applications
Featured Applications
SYNOPSYS™: SYNthesis of OPtical SYStems
A lens design program for the 21st century
by Donald C. Dilworth
The SYNOPSYS™ program has been under development for over 50 years and is one of the largest and most powerful optics codes in the world.
Are you using another optics code? Are you trying to make do with "coordinate breaks" to describe your tilted and decentered components? SYNOPSYS™ offers you not just one, but six coordinate-system options: relative, remote, group, local, global, and external. You tilt the lens element, not an extra dummy surface. And the reverse tilt or decenter is automatic, so you don't have to worry about it. See the path of a ray in the coordinates of the telescope pier if you want. Ghost images a problem? SYNOPSYS™ has eight ways to analyze them. Find the best place to use an aspheric surface, or the best place to insert or delete an element -- automatically. SYNOPSYS™ scans the lens and tells you where. It can tell you the approximate cost of lens blanks. Can your present program do that?
Not sure where the stop should go? SYNOPSYS™ lets you vary an implied stop position during optimization. One variable, no dummy surface needed.
After you design your zoom lens, you need to calculate a CAM curve. SYNOPSYS™ lets you test the fit, watching the image while you cover the zoom range with a slider. Can your present program do that?
Those are just some of the many friendly features you'll find in SYNOPSYS™. This page describes lots more, so keep reading. And if you have lens files written by Zemax™, Oslo™, or Code-V™, SYNOPSYS™ can convert most of those for you too, so you don't have to type them in all over again. Friendly.
SYNOPSYS™ has had regular and frequent updates since it became commercially available in 1976. That's why it is now one of the largest optics codes in the world -- with unmatched features. Here are some of the recent enhancements:
1. Automatic ray-failure correction. Just add the word "FIX" in word three of the SYNOPSYS command, and, if your starting lens won't optimize because of ray failures, the program will try (and usually succeed in) modifying that starting point so all of the rays to be controlled will trace. There is no other optics code in the world with this advanced feature. You'll enjoy this time-saver only with SYNOPSYS™.
2. The program now supports up to 32 cores. Many features run faster than before, some
significantly.
3. Designing free-form systems is now easier than ever. FFBUILD will figure out the mirror angles and let you quickly optimize the system with any of several kinds of aspheric surfaces.
4. Write your own dll and link it with SYNOPSYS. Want a special surface shape that is not already in the program? Write one. Want a special image analysis you can't find anywhere? Write one.
Global optimization is now available in SYNOPSYS™, in two forms: comprehensive binary search and lens construction via the Saddle-Point method. Start with a base configuration and develop derivative designs, automatically. Or let the program do it all for you. Your choice. Even zoom lenses can be designed automatically, with no starting point required.
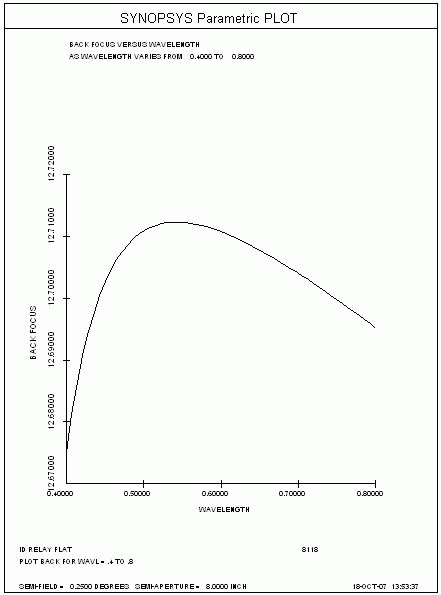
You may have heard of the AI, or artificial-intelligence, capability of SYNOPSYS™. This is a feature found in no other code. It lets you type an English sentence to define your own command or do nearly anything that you want. Sentences like "put the stop on 4", or "plot back focus for wavelength = .4 to .8". With its vocabulary of a few hundred words, this feature makes SYNOPSYS unique, powerful, and friendly. Want to use your sentence again? Simple. Only type it once; define it as a new command, and you've got it. You can set things up so that one click will execute your command -- or do anything else you want. Friendly.
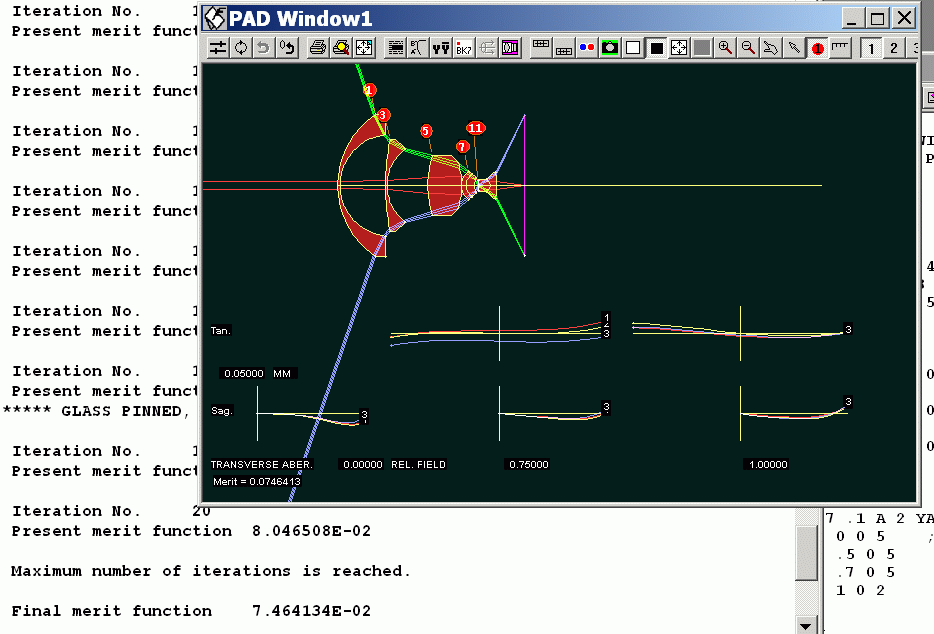
Also of special interest is the SNAPshot feature that shows you the lens and its image during optimization. You can watch the lens change as the image improves.
Here is a video that shows how the sliders in the WorkSheet dialog let you alter nearly anything in the lens -- while you observe the results on the SketchPAD display. You are not limited to just the parameters shown on the dialog, either. Select any number in the edit panel -- and that number can be altered with a slider as well!
You can see your image with realistic colors, either as a spot diagram or a diffraction pattern, in two ways:
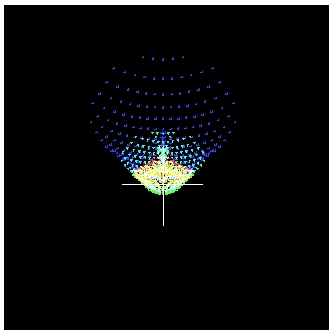
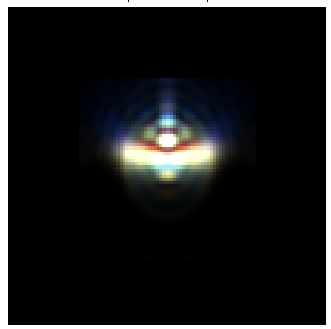
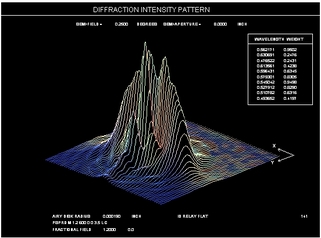
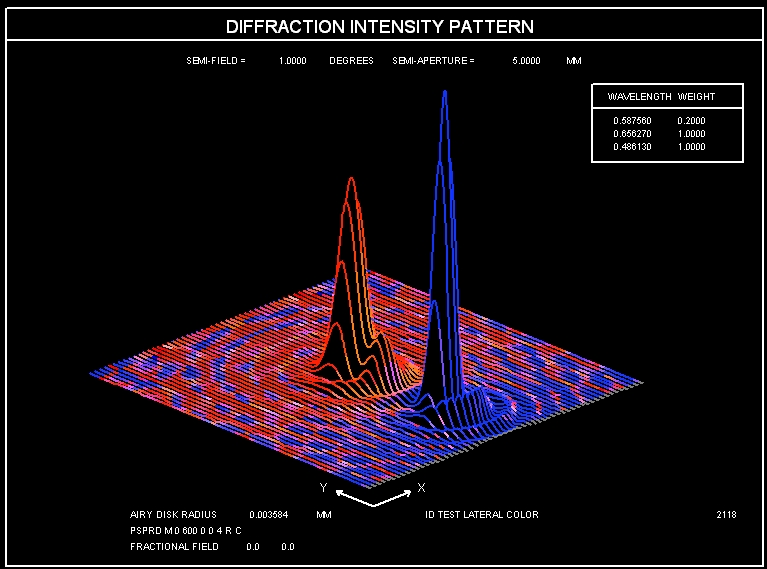
This is the point-spread display of an image with a large amount of lateral color.
Zoom your lens with a slider that lets you examine the elements and image quality at 100 points over the zoom range. Watch the above video of this feature in action. SYNOPSYS lets you correct your lens at 20 zoom positions with a single configuration, and lets you examine 100 positions quickly and easily.
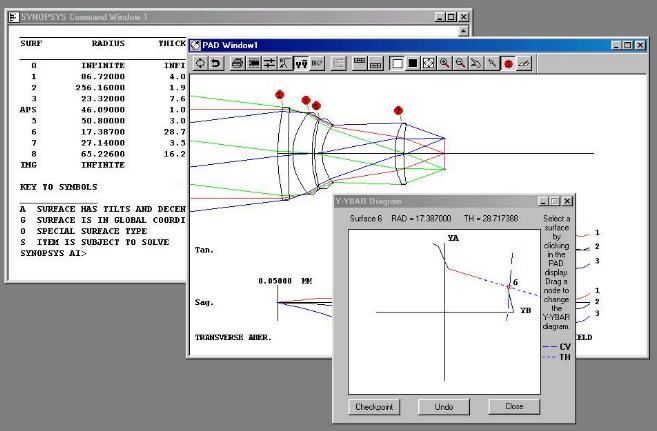
The Y-YBAR feature lets you define your lens by changing the first-order properties at any point in the system.
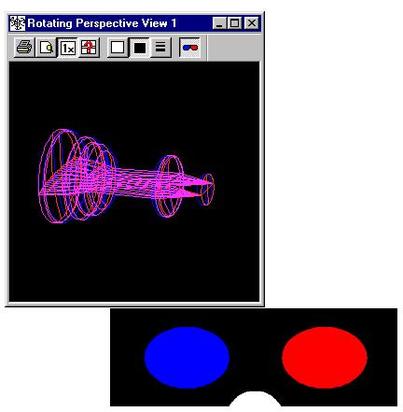
The rotating-perspective feature shows the lens on the screen, where you can easily view it from all angles by dragging with the mouse, even in true 3D with our red-blue anaglyph glasses.
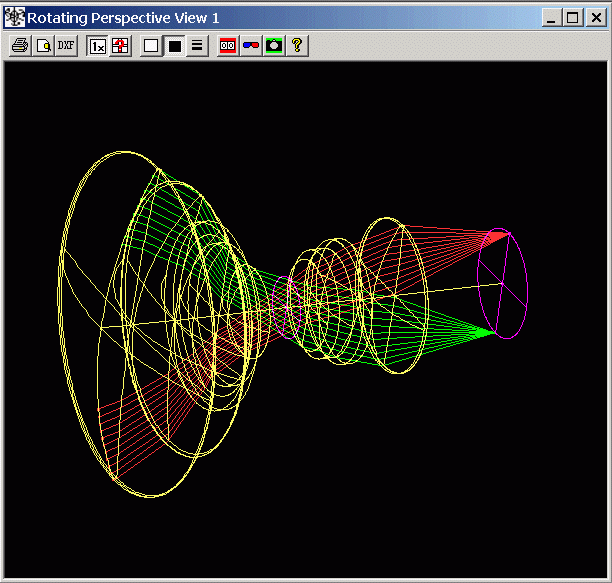
The rotating solid model lets you draw elements in color. Here we look inside a cavity, with multiple reflections. When you're running SYNOPSYS you can spin this around on your monitor by dragging with the mouse.
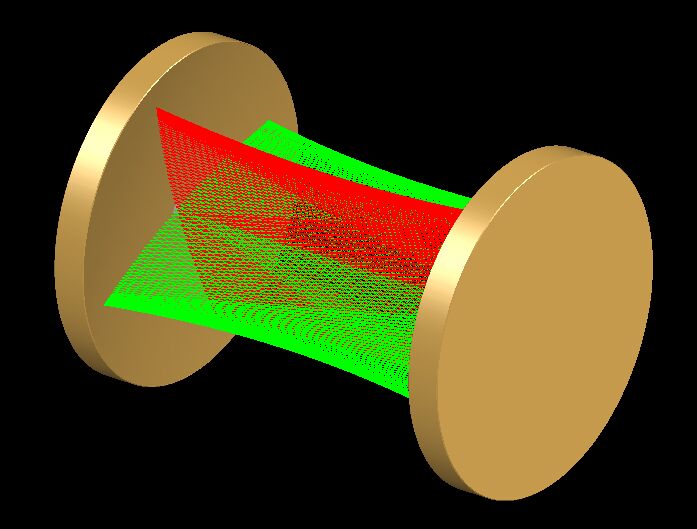
Another example of a solid model. Select any of 16 million colors for the elements.
Watch the video above and see how you can spin the solid model around.
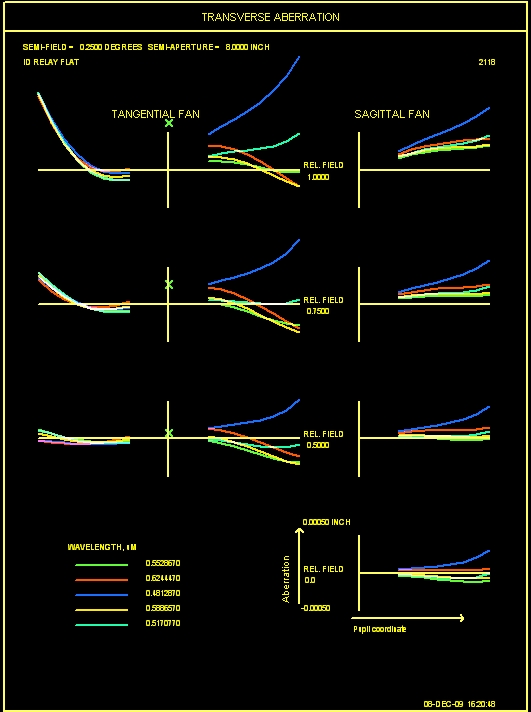
This is a set of transverse ray aberrations, showing approximately the actual color of the light in each fan.
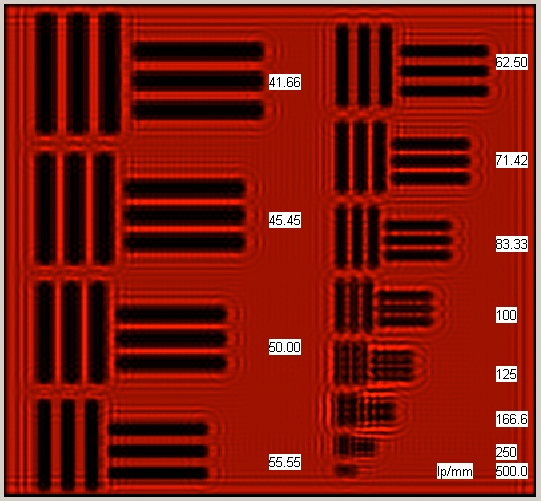
Here is the image of the Air Force resolution target, formed with coherent light: You can model the effects of geometric optics or diffraction on a wide variety of targets, including your own photograph.
SYNOPSYS can model illumination systems too, including arrays of LED sources with Lambertian emission characteristics along with reflectors behind and lenses in fromt. See the light distribution at a desired location.
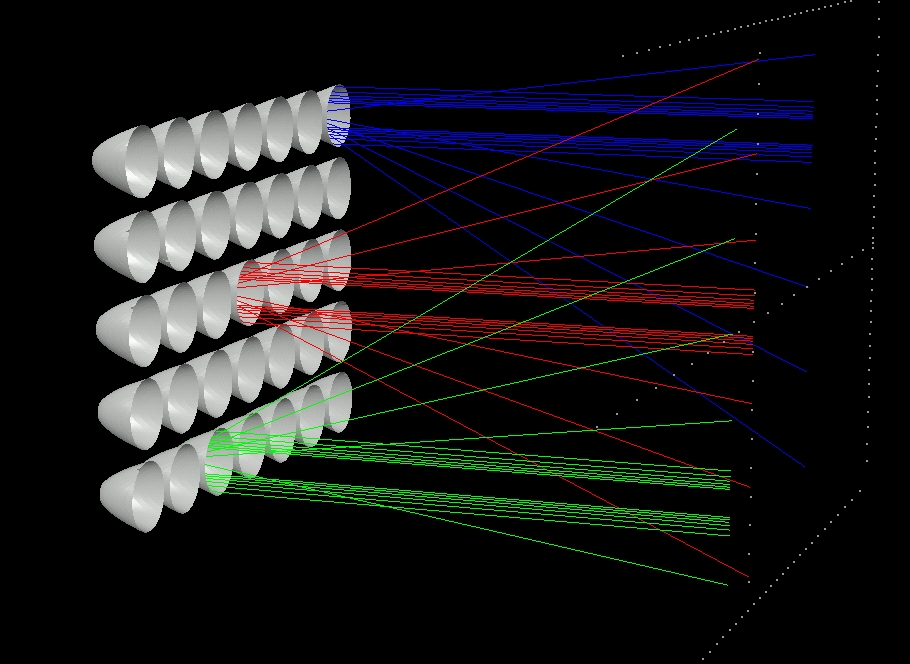
Look at the illumination pattern from your LED source. Here is an example where the light bounces inside a collecting cone:
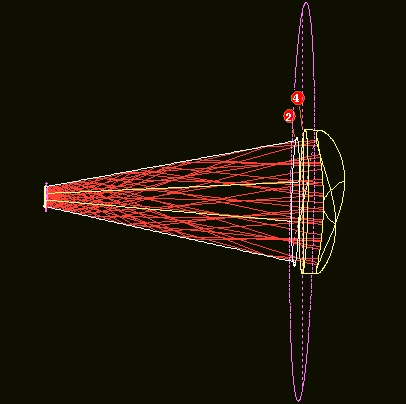
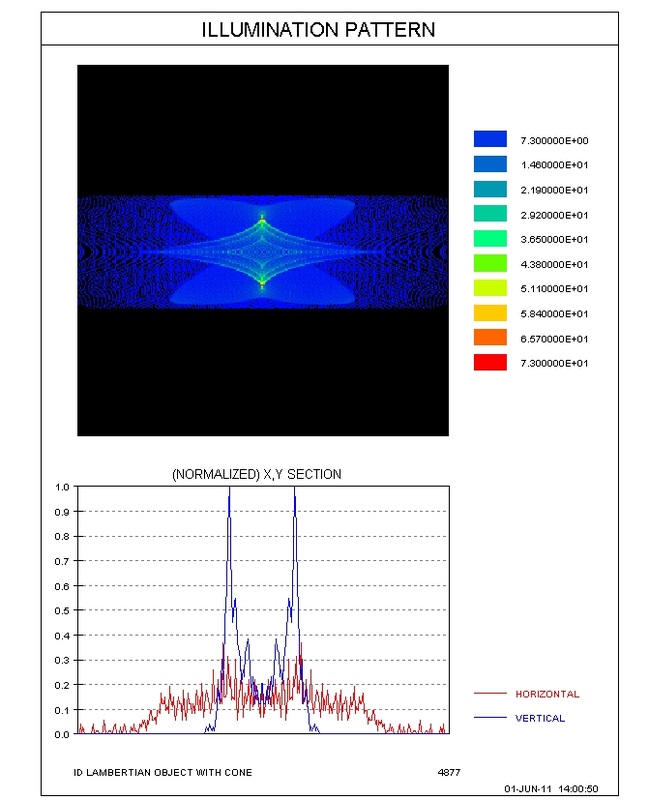
... and produces this illumination on a distant plane:
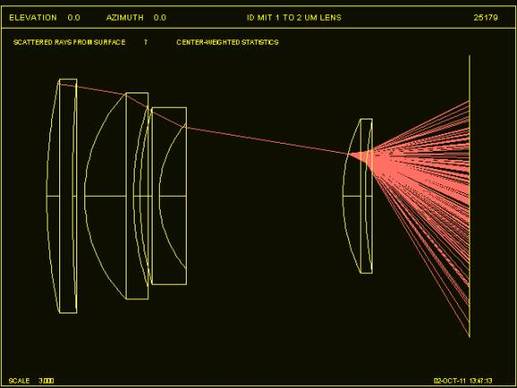
Here is a system that models scattering at the last lens.
SYNOPSYS Feature List
Systems: Refractive, reflective, centered, tilted, decentered, focal, afocal, accomodated afocal, sequential, non-sequential.
Imports: Zemax™, Oslo™, and Code-V™ lens files.
Coordinates: relative to previous surface, global to surface 1, local to previous surface (with Euler angles in any order), external coordinates, such as telescope pier. Output of lens and raytrace data in any coordinate system.
Object: Finite, infinite, Gaussian, Lambertian, fast, polarized; wide-angle, constant object NA, telecentric object, waveguide.
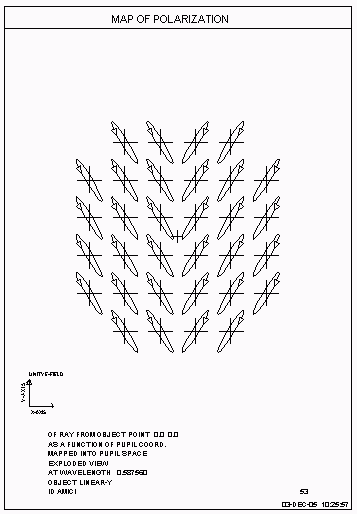
● This is an example of the MAP feature, where you can see the output polarization. See the difference when you apply coatings to the prism surfaces. MAP can show any of 18 items on the plot, including ray coordinates and angles, or hologram frequency.
● Capacity: 200 surfaces, 20 zooms in a single configuration, 10000 aberrations, 400 variables, 10 wavelengths, 6 configurations for simultaneous optimization.
● Pupils: paraxial, real-ray, wide-angle (adjust at stop or at all surfaces), implied pupil via input ray aiming.
● Surfaces: refractive, reflective, holographic, diffractive; coatings considered in raytrace.
● Vendor catalogs: Melles Griot, Inc.; Spindler & Hoyer; Edmund Scientific Company; Newport Corporation; JML Direct Optics; CVI Laser Corporation; and Optics for Research, Inc. Match, insert, or replace a lens element with the click of your mouse with our complete list of 2960 stock lens elements.
● Prism library: Right-angle, Amici, Porro, Penta, Dove, Schmidt, Pechan, Penta-roof, Double porro, Abbe, Pechan-roof, Double-dove. Insert or remove a prism with a single mouse click in the WorkSheet.
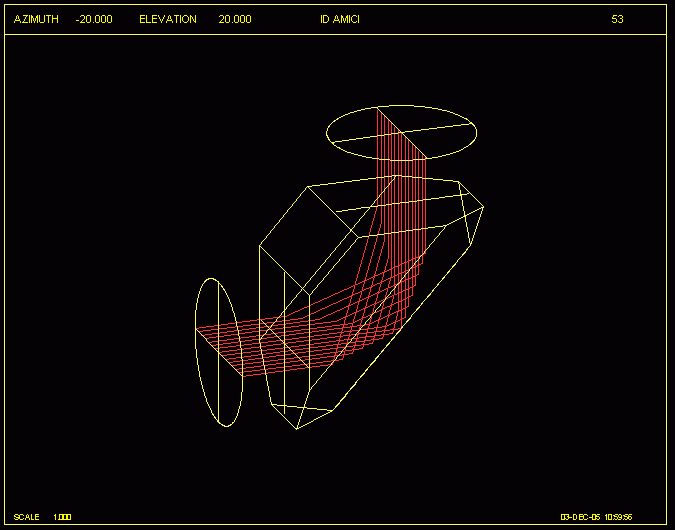
Here is an example of an Amici prism. This uses a roof surface and nonsequential raytracing. It also gives the polarization shown above, if the roof is uncoated. But SYNOPSYS can model coatings too, and it will show the improvement in the polarization that results if the roof is aluminized. You can even design your own coatings with the built-in FILM program.
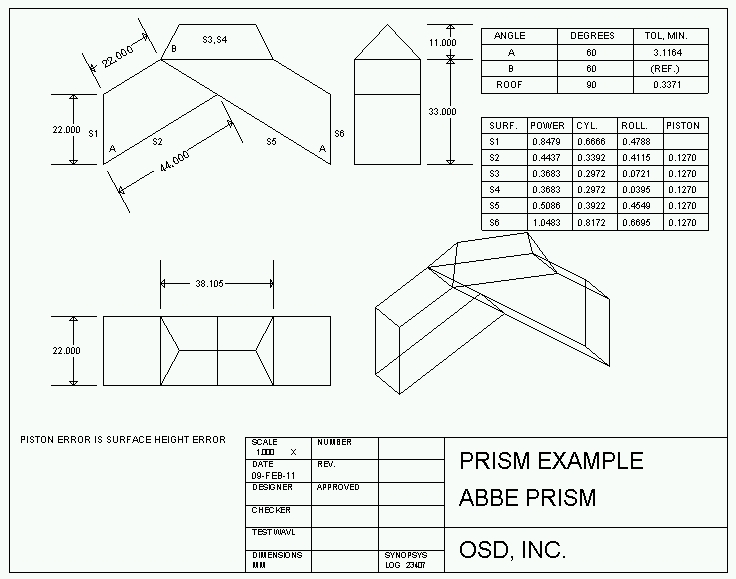
● This is a mechanical drawing of an Abbe prism, along with tolerances generated automatically by the BTOL tolerancing program. Add additional annotation with a mouse click, if you want to.
● Shapes: Flat, sphere, conic section, power-series aspheric, biconic, biradial conic, toric, cylinder, non-rotationally symmetric asphere, perfect Fresnel, Fresnel with explicit zones, grating, holographic element, DOE, Zernike polynomial, linear & cubic spline, odd aspheric, dual-zone aspheric, dual-zone DOE, Forbes poynomial types A and B, Bezier spline, non-rotationally symmetric NURBS, non-symmetric DOE surfaces.
● Materials: Glass catalogs (Schott, Hoya, Ohara, Corning France, Guangming, LZOS, custom), IR & UV materials catalog, glass model, interpolation coefficients, exact indices, calculate coefficients to fit entered index data, wideband coefficients (12 terms), polarizing, birefringent, GRINs. On-screen glass table, graph of selected glass properties. SYNOPSYS will compute the new index of refraction as you change the temperature or air pressure.
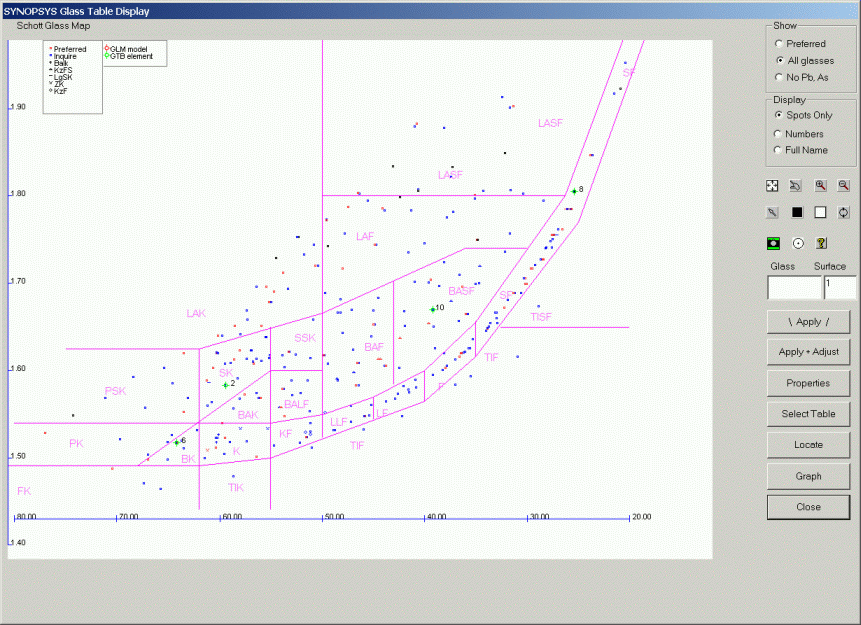
This is a display of the Schott glass map, onscreen. Select a glass type, and its properties can be instantly displayed, as shown below: Look at the cost, chemical properties, or partials of all glasses at the same time, for easy comparison.
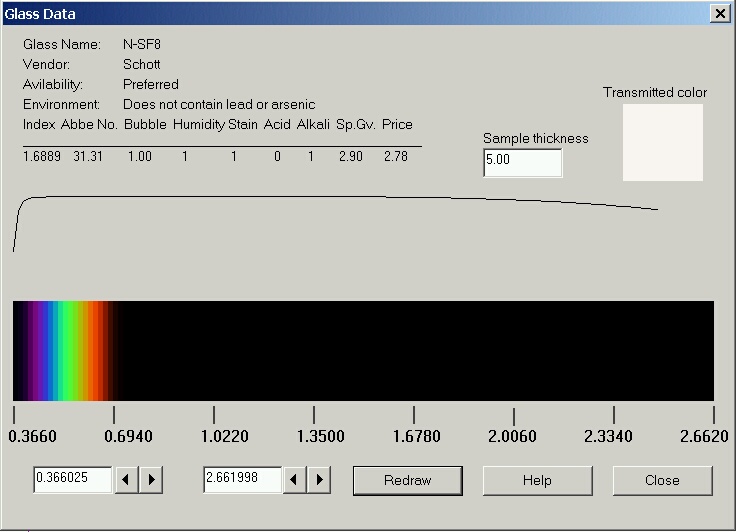
This is the glass properties display for a selected glass type
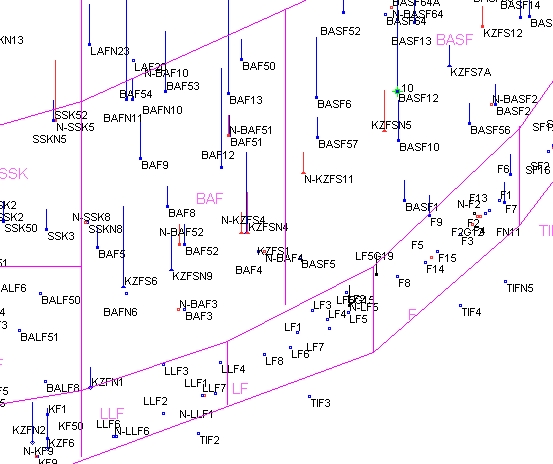
● You can display any of 13 different glass properties on the glass map. Here we look at the stain sensitivity of some flint glasses. Two clicks is all it takes to insert the glass of your choice into the lens.;
● Apertures: Circular, elliptical, rectangular, decentered, inside, outside, polygon inside and outside, apodization, lens bevel, flat, etc.
● System options: Vignetting check, adjust pupil to fill stop, adjust apertures to fit pupil, adjust object size to fill image, specify vignetting as a function of field point, real or paraxial CAO’s, adjust pupil size off axis, insert and remove surfaces, delete pickups, solves, tilts, decenters; fix & free clear apertures.
● Pickups & Solves: Curvature, thickness (scaled + constant), index, tilts and decenters. Solves in both X and Y-directions.
● Basic Analysis: First-order, third-order, fifth-order, paraxial raytrace, real raytrace, targetted raytrace, edge thickness, sag table, element weight, weight of lens, flux uniformity, illumination uniformity, narcissus, ghost image (real, paraxial, buried, plotted), ray fans, OPD fans, Gaussian beam trace, feathering point.
Here is an example of one of the eight kinds of ghost-image analysis features.
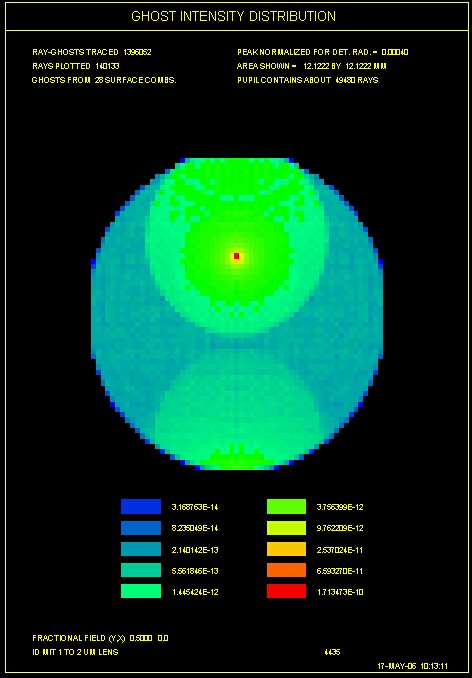
You can show these data in four different formats, including a perspective view of the lens with the paths of selected ghost rays shown.
Utilities: Lens store, get, save, fetch, reverse, scale, fold, unfold, HOE point definition, DOE exposure mask plot, curve fit to interferogram (power-series, Zernike polynomial), thermal soak, thermal shadow, toggle printer capture file, bell, MACro chaining, looping, save plot, get plot, truncate lens, concatenate two lenses, insert element from vendor catalog, recall last 20 commands, calculate estimated cost of lens blanks -- either flat or molded.
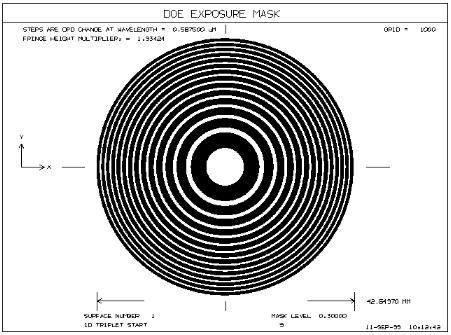
This is the exposure mask for a DOE at the 0.3 point of each fringe.
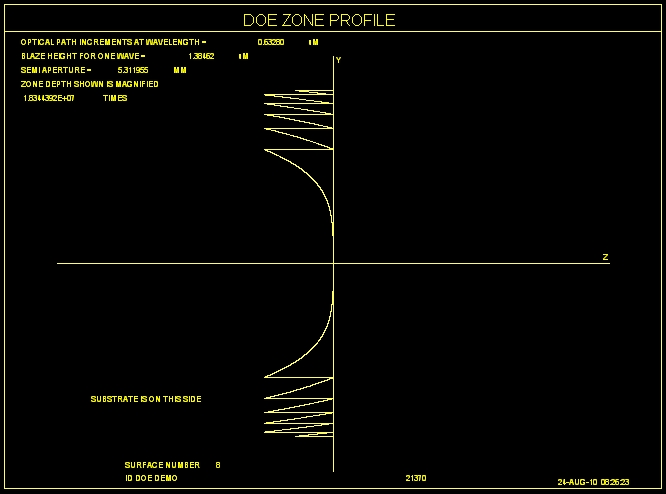
When your DOE is designed and you want to get it manufactured, SYNOPSYS can create a drawing showing the zone profile. The zone height is calculated for you too, based on the emulsion index and the construction wavelength. And the vendor can see if the center is a hill or a hole -- so you don't get surprised later. Can your present program do that?
Pupil Wizard o define the entrance pupil; Spectrum Wizard to combine a source and detector spectrum, assign to lens; Edge Wizard to edit element edge geometry.
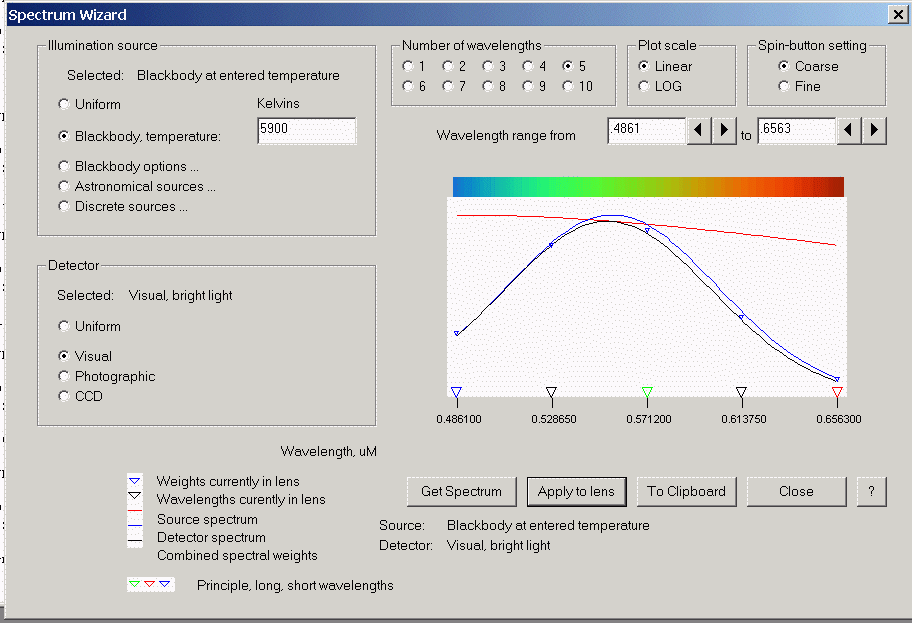
This is the Spectrum Wizard, combining a blackbody curve with the sensitivity of the eye.
Optimization: Variables: Radius, thickness, index, Nd, Vd, conic constant, tilts and decenters in local or global coordinates, aspheric coefficients, spline coordinates, object coordinates, HOE OPD coefficients, afocal accomodation, ZOOM position, GRIN parameters, HOE construction parameters; KICK the lens to escape from local minimum, simulated annealing for global optimization. Can create and optimize a thermal shadow, where configuration 2 is the same as 1, with a temperature difference. Automatic monitoring to control edge thicknesses, center thicknesses (maximum and minimum), surface slope, avoid critical-angle refraction, and lens diameters. Monitor and control interference where an element obstructs the beam in a different part of the system. Global optimization via binary search through parameter space or via saddle-point construction. Automatic ray-failure correction, if the starting lens will not trace.
Alternate Configuration: 6 configurations, pickup curvature, thickness, index, tilts, decenters, HOE coefficients, object coordinates, all surface parameters.
Aberrations: Edge thickness limits, value; automatic ray generation (transverse aberration, OPD, wavefront variance, spot standard deviation); centroid location; OPD Zernike or power-series coefficient target, user-defined rays ((X,Y,Z) coordinates on any surface, (X,Y) distance from chief ray, OPD’s, radial intercept distance, diffraction MTF) ; first-order properties (focal length, back focus, total length, Gaussian image height, exit pupil position, paraxial defocus, object coordinates, F/number, afocal accomodation) ; section first-order properties (front focal length, back focal length, front focal distance, back focal distance, nodal point positions, separation, principal point positions, separation, entrance, exit pupil position, power in air) construction parameters (radius, thickness, index, dispersion, tilt, decenter, narcissus, reverse ghost reflection, aspheric coefficients, surface sag) ; Gaussian beam properties (beam radius, divergence, waist location, waist radius) , HOE point location in (X,Y,Z) third-order aberrations (spherical aberration, coma, astigmatism, Petzval curvature, distortion, primary and secondary axial and lateral color) ; third-order aberrations of selected portion of lens, fifth-order aberrations of lens or portion thereof; second-or fourth-power aberrations; "one-sided" aberrations, define an aberration via an equation; tolerance desensitization; element slope. Options: Derivative list, arithmetic combinations of aberrations, automatic testplate matching, summary of results, changes, final aberration contributions, graphics SNAPshot during optimization, DLS or PSD algorithm
Tolerancing: Inverse sensitivity of user-specified aberrations with respect to user-specified variables; automatic tolerance budget preparation based on wavefront variance, spot variance, Strehl ratio, diffraction MTF, boresite shift, magnification change, distortion change; at user-specified statistical confidence level; includes radii, testplate match, irregularity, thicknesses, index, dispersion, element wedge, element tilt, decenter; up to 4 simple adjustments. Monte-Carlo statistical verification of tolerance budget, with plotted histograms of simulated production runs. Can do full reoptimization during tolerance analysis, to model as-expected recompution or any number of real adjustments.
Basic Graphical Analysis: Lens drawing, perspective drawing, rotating perspective drawing, solid model (optional shading), ray fans, OPD fans, field curves, distortion, element mechanical drawing, surface shape, departure from closest-fit sphere, drawing of all zoom positions, several lenses on one drawing, multiple kinds of analysis on a page, tile screen with several analysis plots.
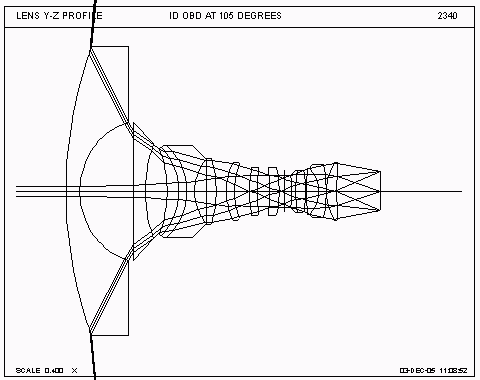
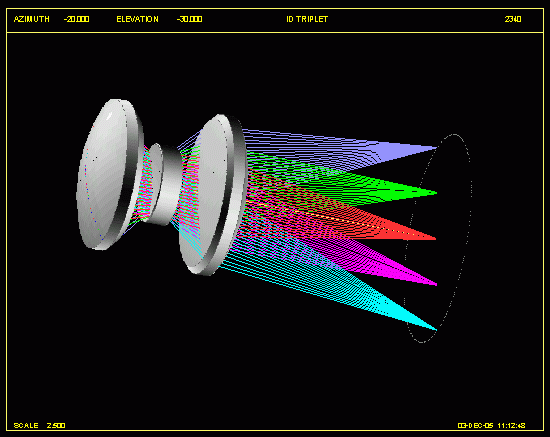
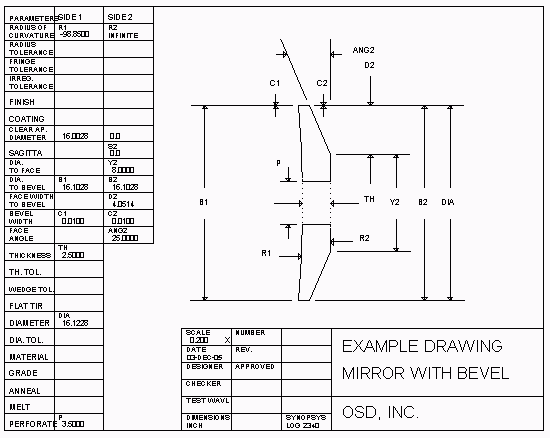
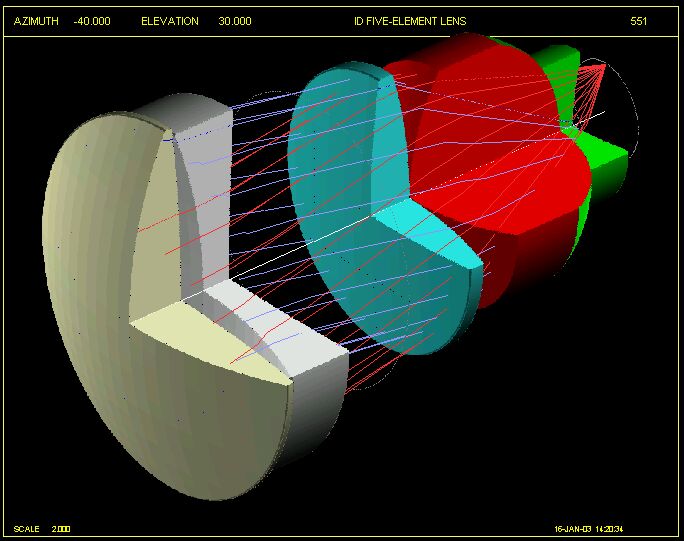
Image Analysis -- Geometric: Footprint, moving-surface footprint, MTF, spot diagram, through-focus spot diagram, knife-edge trace, RMS focusing, RMS spot size, spot standard deviation, through-focus MTF; Image Tools for extended or point target, with or without aberrations.
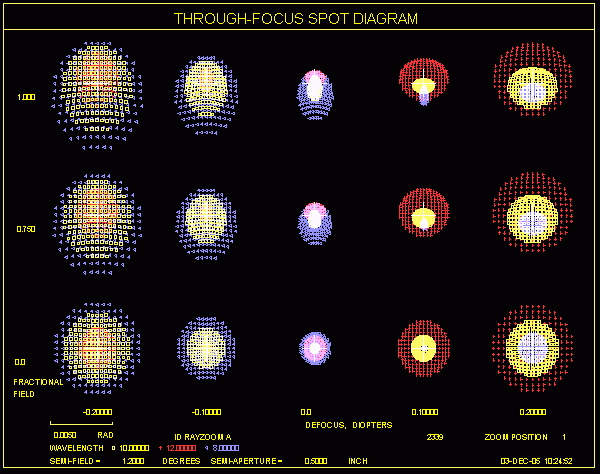
You can also get this analysis with diffraction images, plotted as visual images or as 3-D surfaces, like this:
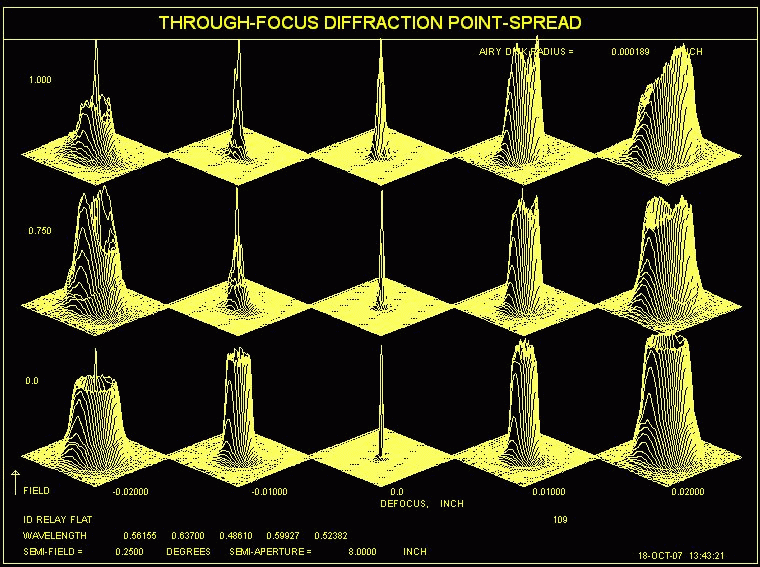
Image Analysis -- Diffraction-based: MTF, through-focus MTF, multi-field MTF, pupil wavefront map, wavefront contours, wavefront fringes, point-spread function, wavefront aberration coefficients, wavefront variance, standard deviation, Strehl ratio, partial coherence analysis, image model, diffraction energy distribution; Image Tools for extended or point target, with or without aberrations..
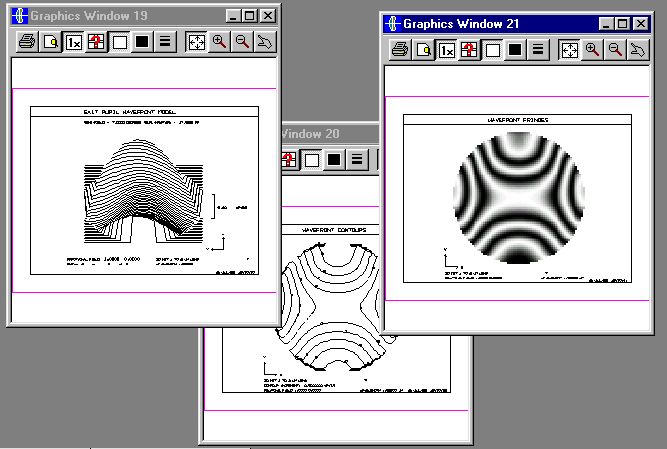
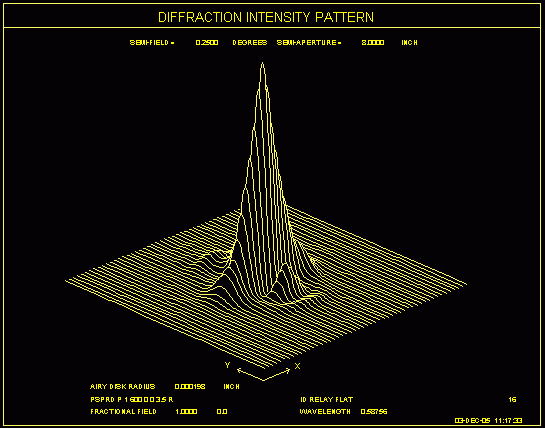
Here is an example of the Graphical System Summary (GSS). This analysis has many optional ways to display the results.
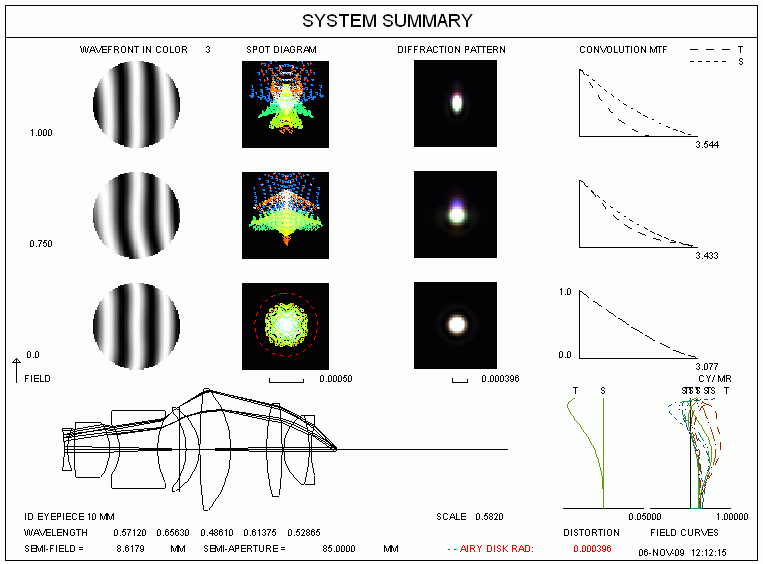
Image Analysis -- Image dissection: Encircled energy, slit trace, knife-edge trace, energy on detector of specified shape and position as a function of size or position.
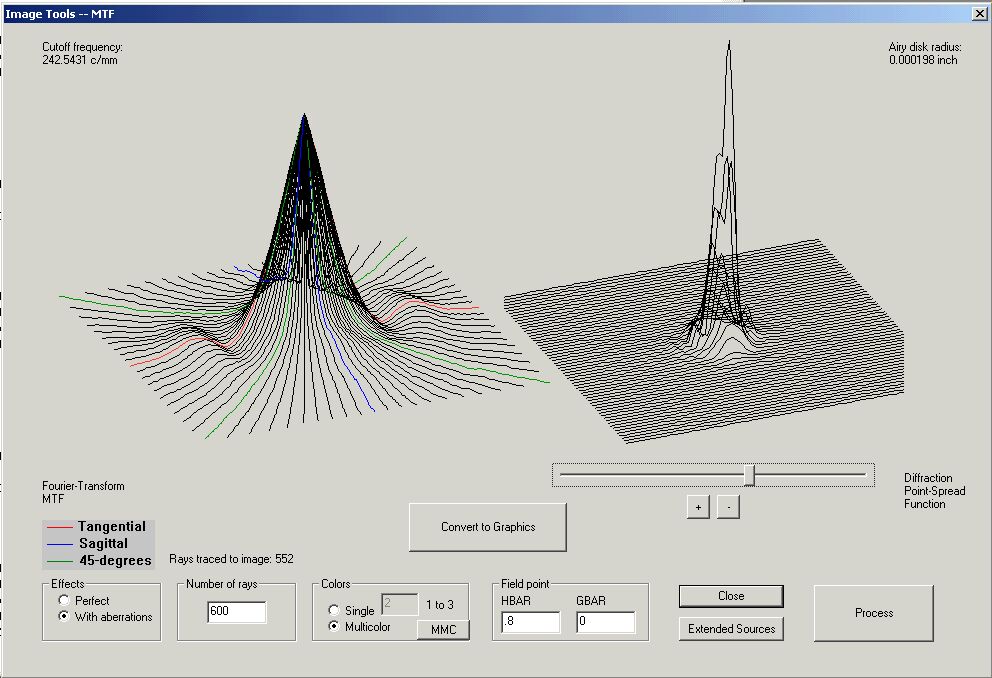
On the picture above you see two surfaces: on the right is the diffraction point-spread function, and on the left is the MTF at that field point, plotted in 3-D. See the slider bar under the diffraction pattern? Drag it and both pictures rotate. Look at either surface from any angle.
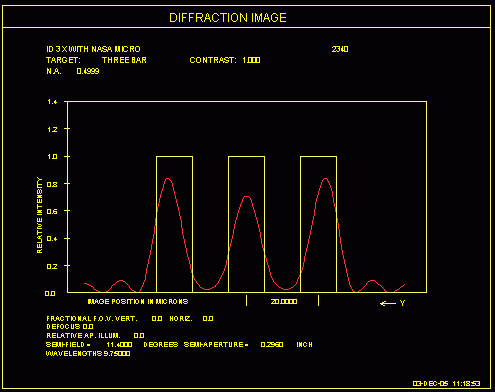
Image Analysis: extended source: Selection of targets: sine, square, three-bar, one-bar, knife-edge, slit, printed text; combine with geometric, diffraction, partial-coherent image.
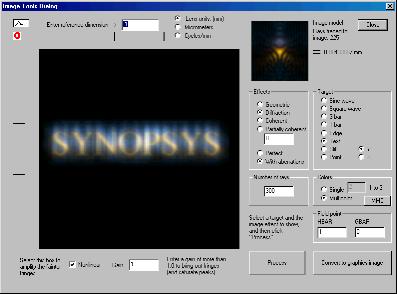
Here is how a sample of text would look imaged by a lens with aberrations, as shown by the Image Tools feature. You can specify any target you want, selected from our menu -- or your own photograph -- to see the effect of lens aberrations and diffraction.
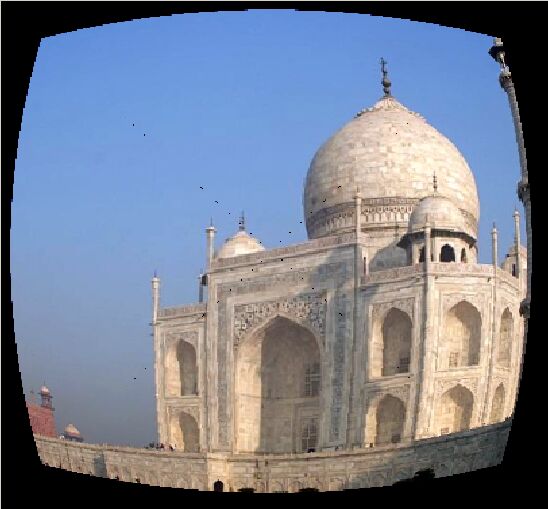
Want to see what an extended object looks like when imaged by your lens?

Mapping function: Map of projected ray angles or incident angles, footprint, X, Y, or Z-coordinates, SAG, HOE frequency, grating frequency, spot diagram, distortion, OPD’s, pupil shape, transmission, polarization; over field of view or over pupil; plotted or printed output; digital or analog format; map of differences between two maps.
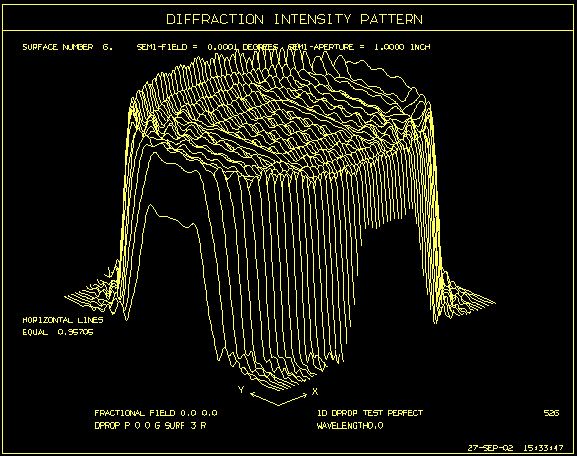
This plot shows the wavefront hitting a surface following a pinhole where the beam is diffracted.
Diffractive Propagation: Examine the intensity profile of a Gaussian beam anywhere in the system, or the effect of a pinhole at an intermediate image. Plot the phase of the fringes in a diffraction pattern.
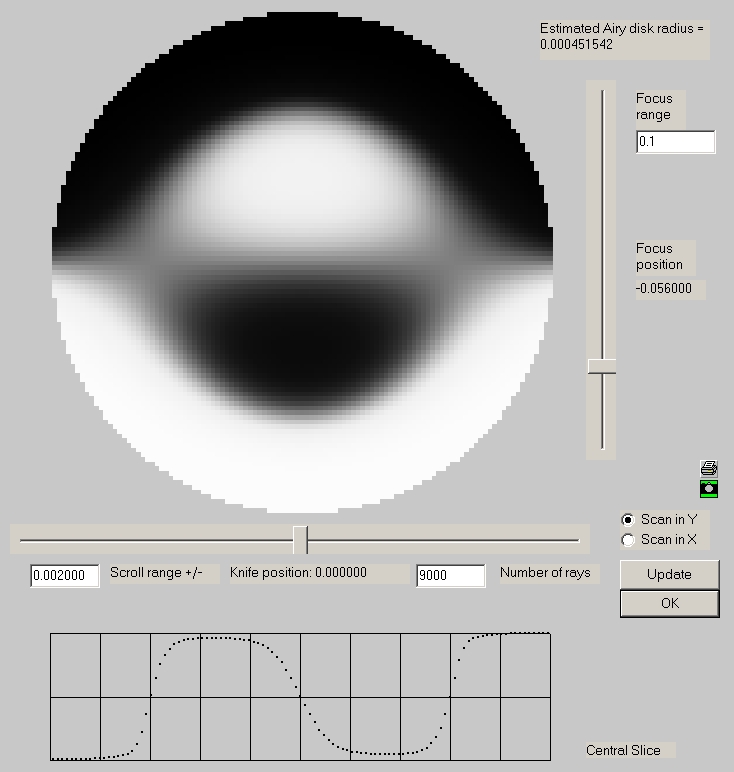
Here is the screen display for an emulation of a Focault knife-edge test of a paraboloidal mirror.
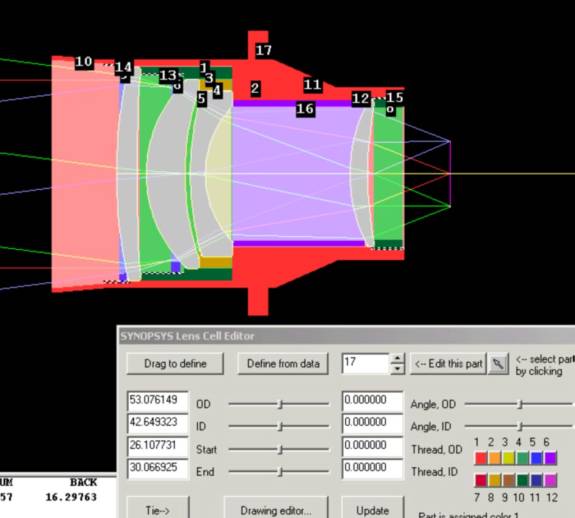
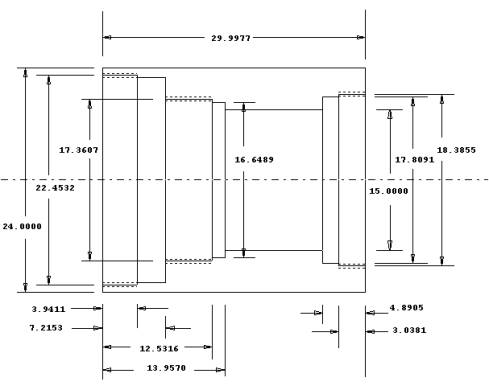
Design the lens cell with SYNOPSYS. Then make drawings of all of the parts, with dimensions.
Engineering options: Model of surfaces or indices displaced at nodes calculated from thermal or structural programs (such as NASTRAN), point cloud of surface sags in global coordinates.
Interactive Features: HELP files (online Tutorial and User's Manual), "Instant HELP", MACro full-screen editor, graphics display, hardcopy output, "SketchPAD" program (split-screen display of lens and image: lens Y-Z profile, perspective drawing, paraxial profile, ray fans, OPD fans, spot diagrams, astigmatic field curves) "WorkSheet" program (edit lens data on screen, pictures update; move sliders to alter curvature, spacing, bending, or slide element; insert and remove surfaces and elements, flip element, split element with airspace or buried surface), programmable toolbar buttons to perform most common tasks instantly, adjust font size onscreen, adjust pen width for plots, dialog windows to perform most optimization and analysis tasks. Spreadsheet dialog for editing most system and surface parameters. Arrow keys to recall last 20 commands.
Artifical Intelligence Features: Natural-language input for altering and retrieving lens parameters, automatic starting-point calculation based on lens data file, lens alteration based on comparison of aberrations with correction obtained in lens data file. Graph of almost anything vs. anything as any lens parameter is varied; symbol-substitution feature to define custom commands. Can search vendor catalogs to find closest match to a given lens.
Here is an example of what the AI feature can do. We typed the English sentence "Plot back focus for wavelength = .4 to .8" This is the result:
